Disclaimer: The documents, data and/or models produced here are for interest only and not subjected to formal validation or review. The aim is to explore open data and test its potential in forestry studies. Use at your own risk.
Kielder forest is situated just south of the border between Scotland and England. The forest area is extensive, so in this project the focus was centred upon stands adjacent to Kielder water (figure 1). The aim was to repeat previous work from Arran and the Carron Valley and explore the potential of LiDAR data to develop height growth models.
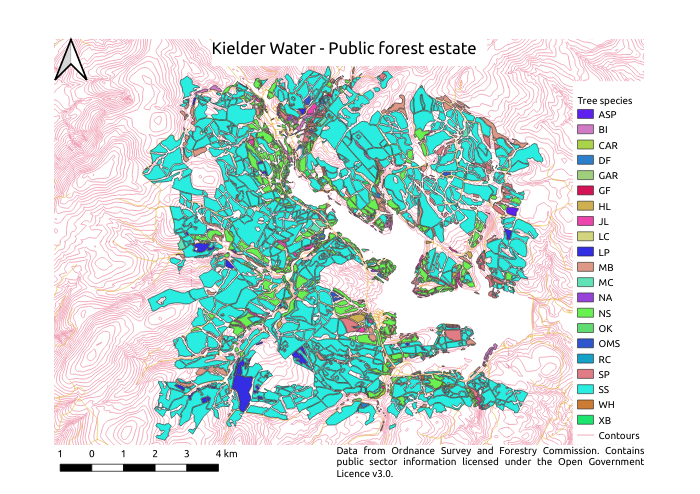
Figure 1: Kielder water and adjacent forest blocks.
Although the dominant species around Kielder water was Picea sitchensis (Sitka spruce), there were sufficient numbers of stands comprising other species to enable models to be fitted for the species table 1. Note that in some cases very limited data was available. However if the models produced similar results to published tables they would suggest this methodology could be used to develop top height models for species that lack height growth functions in British conditions.
Table 1: Species with sufficient data for model fitting.
| Species | Common name (abbreviation) | Number of management units available | Comments |
| Picea sitchensis | Sitka spruce (SS) | 476 | - |
| Picea abies | Norway spruce (NS) | 226 | Removed mixed stands with components of height > 40m |
| Pseudotsuga menziesii | Douglas fir (DF) | 14 | - |
| Pinus sylvestris | Scots pine (SP) | 55 | Removed mixed stands with components of height > 40m |
| Pinus contorta | Lodgepole pine (LP) | 18 | - |
| Larix spp. | Japanese and hybrid larch (JL/HL) | 60 | - |
| Betula spp. | birch (BI) | 118 | Included mixed broadleaved (MB) stands. |
| Tsuga heterophylla | Western hemlock (WH) | 7 | - |
Height data was derived by downloading the digital surface model(DSM) and digital terrain models (DTM), merging those into a single raster file then subtracting the DTM from the DSM to obtain a height dataset. The Forestry England database was used to obtain management unit shapes, species and planting years. The management unit shapes were extracted for an area around Kielder water and edge effects removed by applying a negative buffer of 10 metres. The resulting shape file was then populated with maximum heights from the height dataset using zonal statistics in QGIS. Stand age was calculated by subtracting the primary component planting year from the observation year recorded in the LiDAR metadata (2009). Maximum heights were assumed to be equivalent to the top height of a stand (i.e. height of 100 trees of greatest diameter).
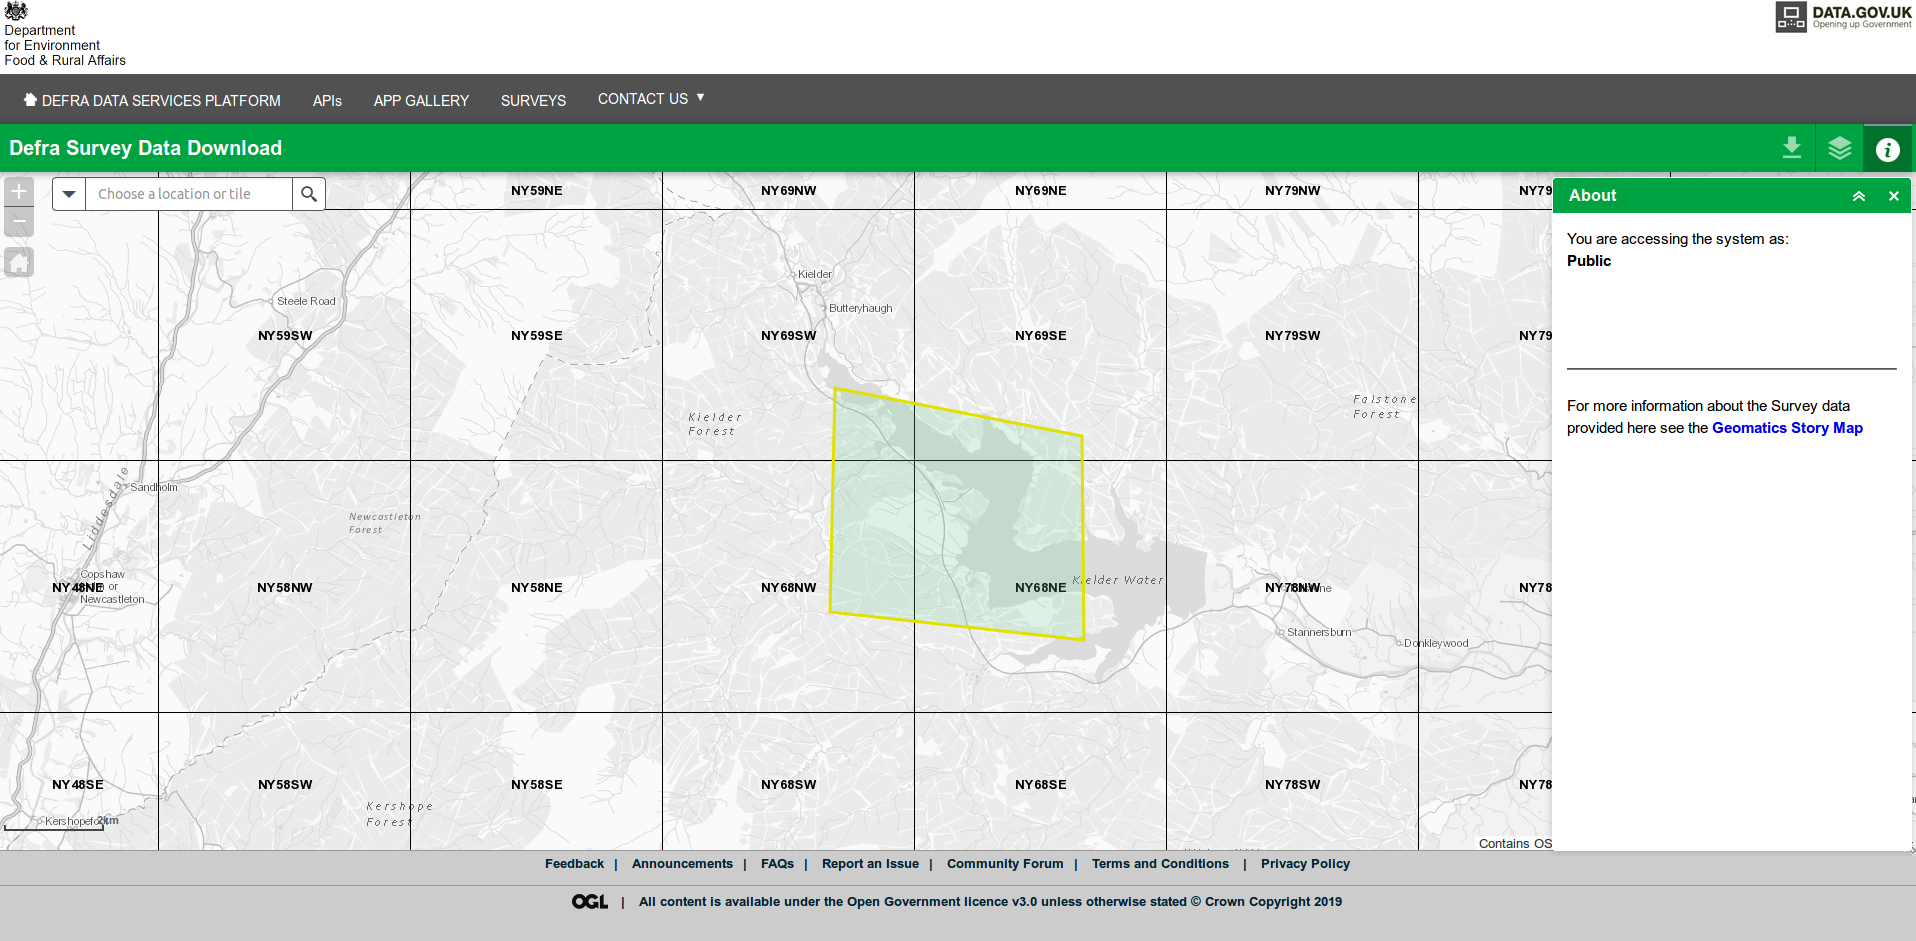
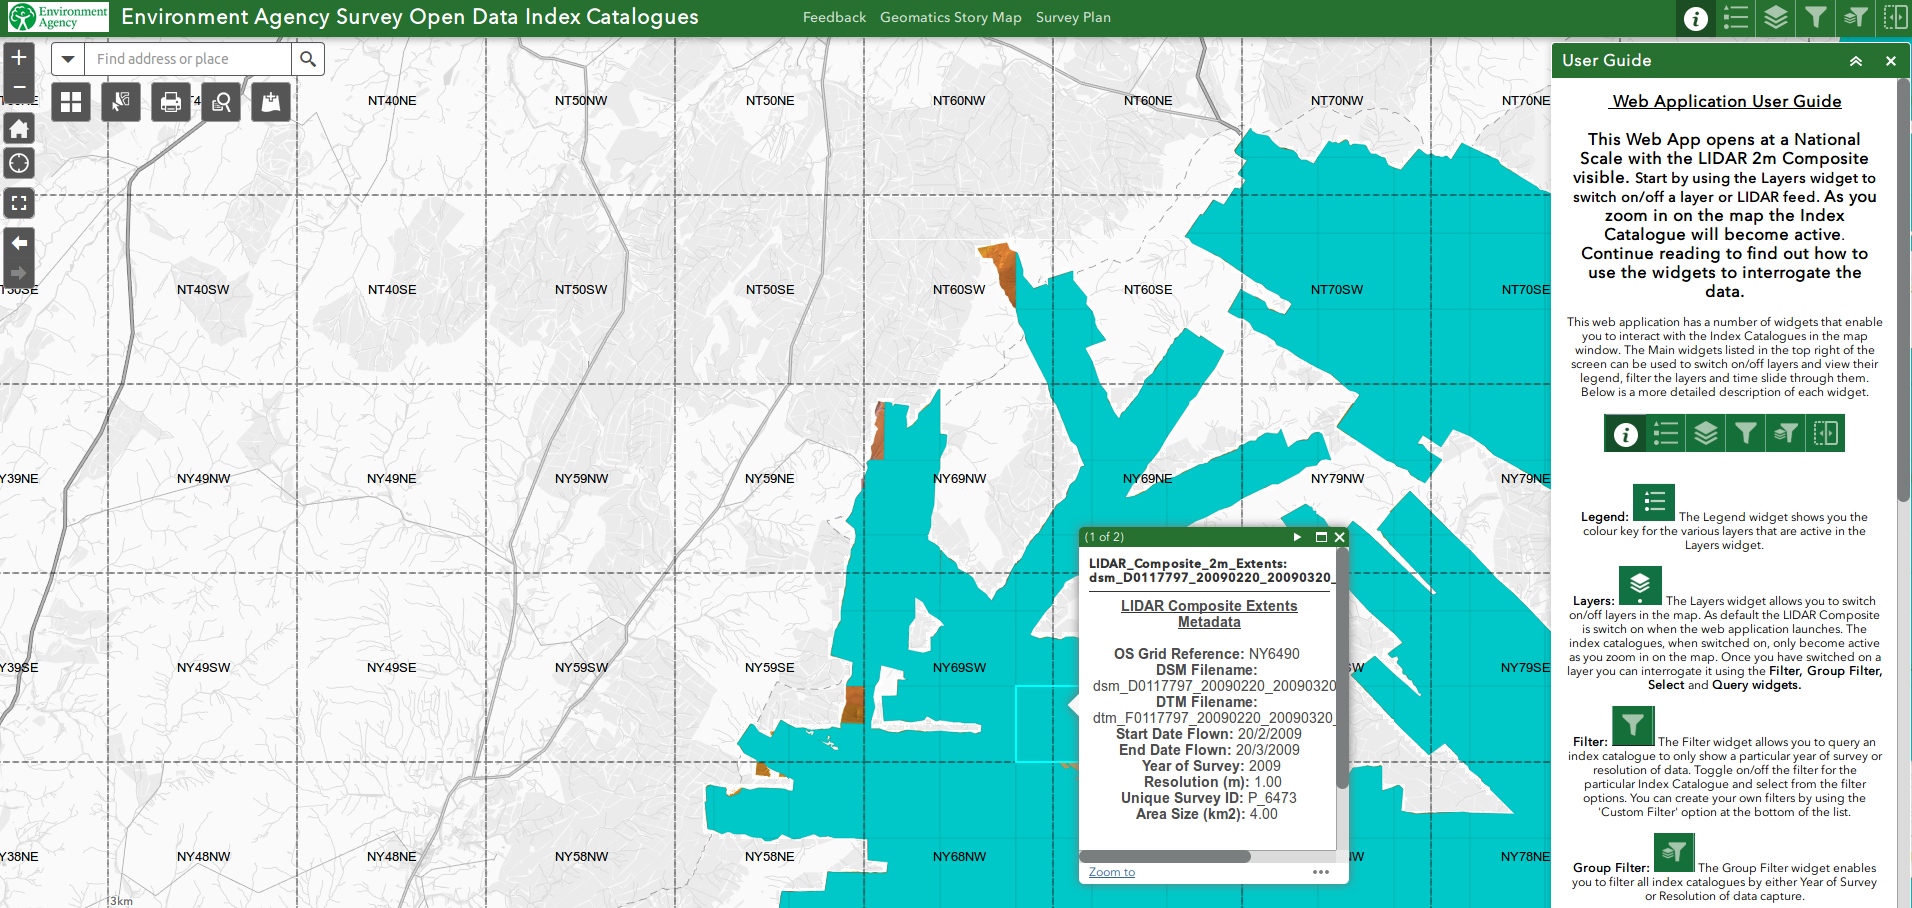
Figure 2: Selecting data and metadata from the DEFRA survey data portal (2019). Top is the data selection tool and below is an explorer tool for metadata extraction.
Unlike the data from the Scottish Remote Sensing Portal, data from the DEFRA portal could be from multiple years and data was available as composite layers or by year. Around Kielder water the metadata suggested observations were from 2009 only so the composite layers were used in this case (figure 2).
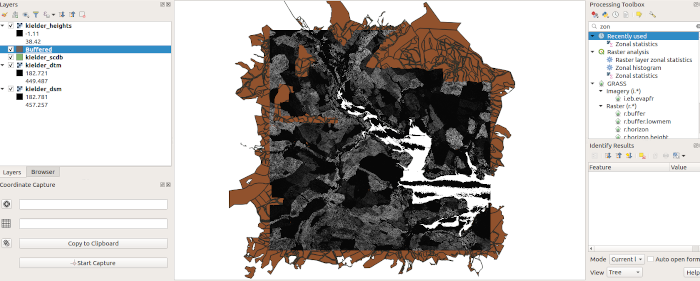
Figure 3: Height data derived from DSM and DTM around Kielder water
Height data (figure 3) was filtered to remove stands with unrealistic tree heights for a given age, as in those cases results were probably related to different age classes and/or species being present on the same site. An example would be a situation where the primary component was regenerating Sitka spruce but the second component was an overstorey of mature trees.
A height model was fitted to the Chapman Richards equation using non linear least squares in R, for all the species in table 1. Other species were not present in sufficient numbers to fit models. To test the results the models were compared against British yield tables published in James (1982).
Models were fitted for 8 species. In the case of larch species data was combined from Japanese and hybrid larch stands, as they are considered to have similar growth characteristics. Mixed broadleaved stands were combined with birch stands based upon the assumption that birch is usually the most common component of mixed broadleaved stands in upland situations such as found at Kielder forest.
Table 2: Parameter estimates for Chapman-Richards equation for the Kielder water dataset. The high b0 values for Douglas fir and Western hemlock are related to those species only being represented on sheltered sites with fertile soils (i.e. good growing conditions).
| Species | b0 | b1 | b2 |
| Picea sitchensis | 31.0984914089268 | 0.0515014708969139 | 1.7888296460156 |
| Picea abies | 30.4459649024326 | 0.0425363946609227 | 1.65430280958719 |
| Pinus sylvestris | 26.6523095556817 | 0.0559614684079033 | 2.0308314294754 |
| Pinus contorta | 23.3644461338817 | 0.0720233130632525 | 2.36155171002998 |
| Pseudotsuga menziesii | 40.4527661501018 | 0.0397614340878214 | 2.04678627781501 |
| Tsuga heterophylla | 36.9465156444705 | 0.0265445882081673 | 1.36440911374648 |
| Larix spp. | 26.3767988213353 | 0.0661126185505212 | 2.25692734690049 |
| Betula spp. | 21.6168587670116 | 0.0653137545341502 | 2.0303946583197 |
Table 3: Predicted top heights according to site index (SI) (height at age 50) for Norway spruce, Sitka spruce, Douglas fir and Western hemlock. British yield table results from James (1982) compared to the equivalent site index using models with parameters from table 2.
| Norway spruce | Sitka spruce | Douglas fir | Western hemlock | |||||
| Age (years) | YC16 (m) | SI 23.2 (m) | YC20 (m) | SI 29.2 (m) | YC18 (m) | SI 30.3 (m) | YC22 (m) | SI 29.8 (m) |
| 20 | 9.4 | 11.4 | 12.0 | 15.3 | 14.1 | 12.0 | 13.6 | 13.5 |
| 30 | 14.9 | 16.7 | 19.0 | 21.9 | 21.2 | 19.5 | 20.2 | 20.0 |
| 40 | 19.5 | 20.5 | 24.9 | 26.4 | 26.5 | 25.7 | 25.6 | 25.4 |
| 50 | 23.2 | 23.2 | 29.2 | 29.2 | 30.3 | 30.3 | 29.8 | 29.8 |
| 60 | 26.3 | 25.0 | 32.3 | 31.0 | 33.1 | 33.6 | 33.3 | 33.3 |
| 70 | 28.7 | 26.3 | 34.7 | 32 | 35.2 | 35.9 | 36.4 | 36.0 |
| 80 | 30.8 | 27.1 | 36.4 | 32.7 | 36.7 | 37.6 | 39.6 | 38.1 |
Table 4: Predicted top heights according to site index (SI) (height at age 50) for birch, larch (Japanese and hybrid), Scots pine and Lodgepole pine. British yield table results from James (1982) compared to the equivalent site index using models with parameters from table 2.
| birch species | larch species | Scots pine | Lodgepole pine | |||||
| Age (years) | YC6 (m) | SI 18.4 (m) | YC8 (m) | SI 19.6 (m) | YC8 (m) | SI 30.3 (m) | YC10 (m) | SI 21.1(m) |
| 20 | 10.9 | 10.5 | 10.2 | 10.6 | 6.7 | 8.1 | 9.0 | 11.9 |
| 30 | 14.6 | 14.6 | 14.4 | 15.3 | 10.3 | 11.9 | 14.0 | 16.9 |
| 40 | 16.9 | 17.1 | 17.4 | 18.1 | 13.5 | 14.6 | 18.0 | 19.7 |
| 50 | 18.4 | 18.4 | 19.6 | 19.6 | 16.3 | 16.3 | 21.1 | 21.1 |
| 60 | 19.3 | 19.1 | 21.3 | 20.4 | 18.5 | 17.4 | 23.8 | 21.8 |
| 70 | 20.0 | 19.5 | 22.7 | 20.9 | 20.4 | 18.1 | 26.2 | 22.2 |
| 80 | 20.5 | 19.7 | 23.8 | 21.1 | 21.9 | 18.5 | 28.3 | 22.4 |
The fitted models generally underestimated long term growth compared to data from James (1982). This could be related to earlier felling or windthrow of faster growing stands, so that they are unrepresented in the data in later age classes. The exception in this regard was Douglas fir, as this species is usually planted on the best sites and often retained for amenity purposes because it is only present in small stands. Another reason why the LiDAR derived models could be less reliable in older age classes are improvements in genotype selection, so younger stands have seed origins better matched to site conditions. However only Sitka spruce has been subject to extensive breeding trials in Great Britain ().
To provide a larger dataset the birch model was fitted with stands recorded as birch, and stands recorded as mixed broadleaves. Mixed broadleaved stands in upland situations are likely to be have birch as a dominant or codominant species, especially where they follow NVC woodland types. We cannot discount the possibility that those stands also included other species or age classes that would lead to misrepresentations of the growth profile of birch. However the benchmark comparison for the birch model was also a composite growth model for sycamore, ash and birch (James, 1982).
Apart from Sitka and Norway spruce most of the other species were not well represented. This reflects the historic management aims of the forest (commercial softwood forestry). The convergence of species with small numbers of stands was related to even distribution across age classes and possibly the consistent establishment on similar site types. However normally it is recommended that around 100 height-age measurements are used to fit models and that those are selected so that the mean, maximum and minimum growth rates are represented across age classes as much as possible (Kershaw et al, 2017).
LiDAR data was used to fit height growth models for 8 tree species found around Kielder water. The models were generally within 10% of previously published top heights from yield tables, though they tended to suggest a premature culmination in height growth. Using those methods can provide a means to derive height growth models for minor species that are not presently represented in British forestry.
LiDAR Growth models Sitka spruce Picea sitchensis Norway spruce Picea abies Betula spp. birch Kielder Forestry England