Disclaimer: The documents, data and/or models produced here are for interest only and not subjected to formal validation or review. The aim is to explore open data and test its potential in forestry studies. Use at your own risk.
The prediction of stand growth rate allows foresters to estimate future yields and determine site suitability particularly for production objectives. In this study the aim was to examine whether height growth models derived from LiDAR could be used with bioclimatic and topographic variables to predict the site index (growth rate) of Picea sitchensis (Sitka spruce) on Arran.
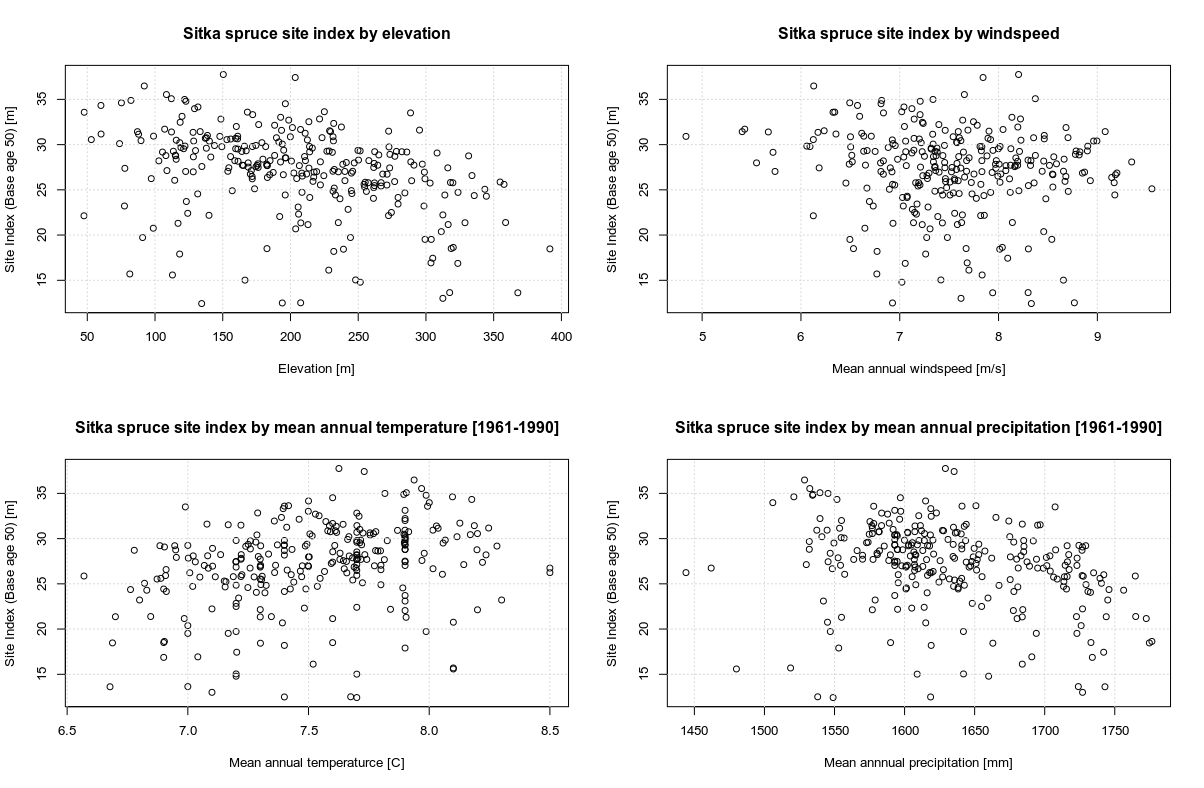
Figure 1: Variation of site index (height at age 50) for Sitka spruce according to topographic and bioclimatic factors on Arran.
Although the dominant species around Kielder water was Picea sitchensis (Sitka spruce), there were sufficient numbers of stands comprising other species to enable models to be fitted for the species table 1. Note that in some cases very limited data was available. However if the models produced similar results to published tables they would suggest this methodology could be used to develop top height models for species that lack height growth functions in British conditions.
Table 1: Summary statistics for Sitka spruce stands on Arran
| Variable | Minimum | Mean | Median | Maximum |
| Elevation (m) | 47.6 | 204.6 | 204.0 | 391.5 |
| Mean annual temperature (C) | 6.5 | 7.5 | 7.5 | 8.5 |
| Precipitation (mm) | 1444 | 1619 | 1632 | 1776 |
| Windspeed (m/s) | 4.8 | 7.5 | 7.5 | 9.6 |
| Age (years) | 12 | 38 | 39 | 57 |
Bioclimatic data was obtained from WorldClim (2019). Two bioclimatic variables were considered from WorldClim, namely mean annual temperature and precipitation from the 1961-1990 period. A third bioclimatic variable, windspeed, was obtained from the Global Wind Atlas (2019). The WorldClim data were at approximately 1km resolution and the windspeed data at around 300m. A digital elevation model from the Ordnance Survey (2019) was used to test the influence of altitude on growth. Stand age was also tested as a predictor variable to look at possible influences in changes of seed origin, climate and management upon growth rate.
Linear regression models were tested for their predictive ability of site index from bioclimatic and topographic variables. A weakness of this approach was that the influence of soil was not considered, as no local data were available publicly at a useful scale. The use global modelled climate data potentially limits the ability to derive precise models as those will inherit modelling errors associated with the downscaling and production of the modelled data from observed values.
Model 1 Site index (base age 50) m = b0 + b1.elevation + b2.temperature + b3.windspeed + b4.precipitation
Model 2 Site index (base age 50) m = b0 + b1.elevation + b5.age
Model 3 Yield class (m3/ha/y) = b0 + b1.elevation + b2.temperature + b3.windspeed + b4.precipitation
Model 4 Yield class (m3/ha/y) = b0 + b1.elevation + b5.age
The use of the site index model rather than yield class was based upon trials that showed that the growth pattern of the Sitka spruce site index model was linearly correlated (R2= 0.97) with yield tables, (figure 2) and had the advantage it was easier to automate than manually comparing LiDAR data to published yield tables to obtain yield class. Directly fitting against yield class was trialled but the accuracy of the data was questionable as unlike the direct comparison of growth models, there was considerable scatter in the plotted relationship between observed top height from LiDAR and the subcompartment yield class (figure 3).
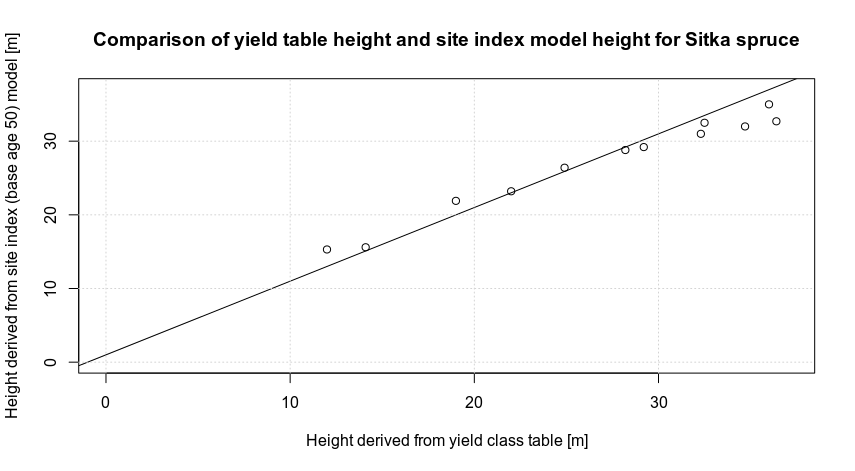
Figure 2: Yield table results (James, 1982) plotted against site index models derived from LiDAR.
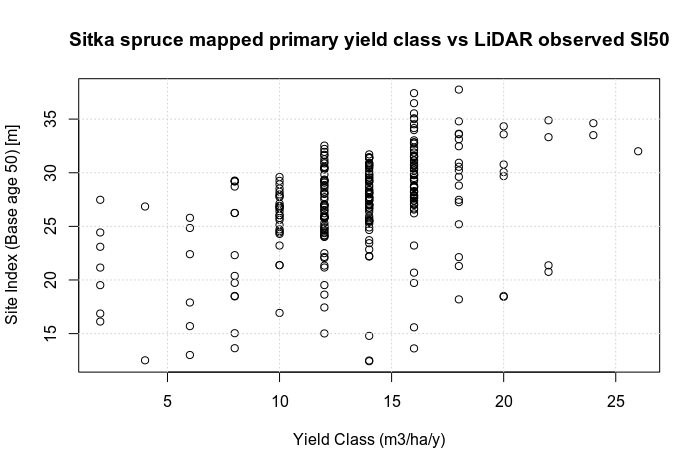
Figure 3: Subcompartment yield classes ploted against observed site index from LiDAR.
Models were fitted for 4 models, two using site index as the dependent variable and two using yield class as the dependent variable (table 2). The site index model using age and elevation explained the most variance in growth rates. However the low R2 values limit the use of the models in situations when a predicted growth rate is required.
Table 2: Model parameter estimates and fit. Parameter significance, 0.001=*** (highly significant), 0.01=**, 0.05=*, 0.1=#, not significant = ns
| Model | b0 | b1 | b2 | b3 | b4 | b5 | R2adj | RSE |
| Model 1 (SI50) | 66.263416** | -0.030014** | -2.422101ns | -0.386397ns | -0.007306ns | - | 0.13 | 4.39 |
| Model 2 (SI50) | 39.155170*** | -0.027933*** | - | - | - | -0.163140*** | 0.22 | 4.16 |
| Model 3 (YC) | 39.486892* | -0.019566* | -1.153766ns | -0.489428# | -0.005933ns | - | 0.13 | 3.55 |
| Model 4 (YC) | 18.436734*** | -0.019785*** | - | - | - | -0.024487ns | 0.13 | 3.55 |
LiDAR data was used to determine actual yield class for 10 subcompartments by comparing observed heights with yield tables (table 3). While this was a limited sample significant differences were observed, in one case (subcompartment id = 340023718) the recorded yield class was underestimated by 10 units.
Table 3: Subcompartment yield classes compared to LiDAR derived yield classes, for 10 stands on Arran.
| Sitka spruce subcompartments on Arran | ||||||
| SCDB_ID | Yield Class (m3/yr/ha) | Stand LiDAR height (2012) | LiDAR YC (m3/yr/ha) | Planting year | Age | LiDAR-SCDB YC |
| 340005992 | 16 | 22.8 | 20 | 1980 | 32 | 4 |
| 340002452 | 12 | 16.8 | 16 | 1980 | 32 | 4 |
| 340006149 | 18 | 25.4 | 24 | 1978 | 34 | 6 |
| 340016063 | 16/20 | 32.0 | 24 | 1962 | 50 | 4 |
| 340021449 | 14 | 24.3 | 14 | 1961 | 51 | 0 |
| 340005894 | 12 | 10.1 | 12 | 1986 | 26 | 0 |
| 340005343 | 8 | 26.5 | 16 | 1963 | 49 | 8 |
| 340005836 | 14 | 19.7 | 22 | 1983 | 29 | 8 |
| 340005232 | 14 | 24.7 | 18 | 1969 | 43 | 4 |
| 340023718 | 14 | 28.3 | 24 | 1972 | 40 | 10 |
Elevation and age where statistically significant factors in the prediction of growth rates. At the spatial scale of the study climatic variations are encapsulated within the elevation variable. Older stands were predicted to have lower growth rates than younger stands. This may be due to warming climate, improvements in seed origin selection for Sitka spruce planted in Britain or enhanced growth related to establishment practice. The unexplained variation is likely to be attributable to micro site character, such as soil type or underlying geology which are known to be related to growth potential in Scotland (Taylor, 1994).
Arran is a relatively small region and the variation in macro climate variables such as temperature can be accounted for by elevation. The lack of windspeed effects could be related to the presence of topographic shelter which was not included in the analysis. It may be possible to quantify the influence of macro climate data by incorporating data from different sites across Scotland and local site factors such as valleys using topographic indices. The current distribution of LiDAR data does not however cover many public forests and is biased towards sites with hydrological interest.
A follow up study is required to explore the potential of a LiDAR DTM at 1m resolution compared to the 50m product from the Ordnance Survey. Using a higher resolution elevation model would also allow the calculation of meaningful topographic indices of wetness.
The prediction of yield class directly from subcompartment data did not produce accurate models. An analysis of yield classes compared to LiDAR observed heights across 10 subcompartments revealed that recorded yield classes in the subcompartment database were underestimated by 4.8 units on average, and by 10 in the extreme case. The metadata surrounding the subcompartment database does not document the method by which yield class if derived but this analysis would suggest they are estimates rather than field measurements.
The derived models suggest that approximately 80% of the variance in site index is unexplained from the variables tested. The next step will be to develop localised site characteristics from remote sensing data and evaluate if they improve the predictive ability of models.
The site index of Sitka spruce was found to be weakly correlated to bioclimatic and topographic variables on Arran. Year of planting was a significant factor alongside elevation and there was no statistical significance in any bioclimatic variables tested.
LiDAR derived site index models had slightly higher R
LiDAR Site index Picea sitchensis Sitka spruce Arran yield class